Executive Summary
Offshore platform deformation monitoring combines GNSS positioning, precise levelling, robotic total stations, and seafloor pressure transponders to detect millimetre-scale movements in structures worth billions. The central challenge is determining what moves relative to what – the platform may subside from reservoir compaction while individual wells push upward from thermal expansion (conductor growth), creating dangerous relative displacements that stress flowlines and wellhead connections. The Ekofisk field demonstrated the consequences of insufficient monitoring when 2.5 m of seabed subsidence required a $1 billion platform jacking operation. Modern monitoring programs use a four-level approach: absolute GNSS positioning, relative deck surveys, downhole compaction measurements, and seafloor transponder networks. Geomatics is the only discipline capable of integrating these measurements into a single coordinate framework and determining whether observed movements are statistically significant.
On this page14 sections
- The problem nobody sees coming
- What actually moves
- Platform subsidence
- Conductor growth and wellhead uplift
- Structural deformation
- The measurement challenge
- Level 1: absolute position (GNSS)
- Level 2: relative deck network (levelling and total station)
- Level 3: downhole measurements
- Level 4: seafloor monitoring
- The statistical question
- What good monitoring looks like
- Where geomatics fits
- The bottom line
The problem nobody sees coming
An offshore platform doesn’t move. That’s the assumption. It sits on the seabed, bolted to jacket piles driven 80 metres into clay, and it stays put. The wells produce. The flowlines carry product. The separators process it. Everything works.
Until the survey team reports that wellhead number seven is 28 mm higher than it was six months ago, relative to the deck benchmarks. Relative to what, though? Are the deck benchmarks themselves stable? Independent levelling and GNSS say no: the entire platform has settled 8 mm in absolute terms (the deck is now at -8 mm), while the wellhead has grown 20 mm absolute from thermal expansion (now at +20 mm). The reading the survey team saw, +28 mm, is the difference between the two. That changes the picture entirely. You have 28 mm of relative displacement between the wellhead and the deck structure, and every flowline connection to that well is carrying loads it wasn’t designed for.
This is a deformation monitoring problem. And it belongs to geomatics.
What actually moves
Three things can happen on an offshore platform, and they can happen simultaneously. That’s what makes this difficult.
Platform subsidence
Reservoir compaction. When you extract hydrocarbons from a porous reservoir, pore pressure drops. The rock matrix compacts. The overburden settles. The seabed sinks. And whatever sits on that seabed – your platform, your jacket, your piles – goes with it.
The textbook case is Ekofisk, in the Norwegian North Sea. This high-porosity chalk reservoir produced from Danian and Maastrichtian formations with porosities of roughly 30 to 45 per cent. As reservoir pressure was depleted, the effective stress rose and the weak chalk underwent pore collapse. The subsidence was first identified in late 1984; by the spring of 1985 the platforms sat about 2.5 metres lower than at installation, with the seabed depression centred on the most heavily produced part of the field. In the summer of 1987 the platform decks were physically jacked up by around 6 metres. The combined cost of the subsidence remediation effort approached one billion US dollars. Total seabed subsidence over field life eventually reached on the order of 10 metres.
Ekofisk is the extreme case. But subsidence occurs to some degree across many producing fields, and separating true reservoir compaction from the other movements a structure shows is its own analytical problem (subsidence versus growth). A 2024 review of offshore subsidence monitoring compiled representative rates from several Norwegian fields: Valhall around 250 mm per year at its peak (the field’s rate has varied widely over time, from roughly 25 cm/year down to single-digit centimetres as production and water injection changed), Sleipner about 21 mm per year, Troll about 12 mm per year, and Ormen Lange – a subsea development with no fixed platform – nearly 5 mm per year of seabed settlement.
Valhall aside, those single-digit-to-low-double-digit rates don’t look dramatic. But they accumulate. And they create differential movements between platform elements that aren’t settling at the same rate. Valhall is the reminder that the upper end of the range is not theoretical.
Conductor growth and wellhead uplift
This is the opposite problem. Instead of sinking, the wells push upward.
The mechanism is straightforward. Hot reservoir fluid – sometimes 150°C or more – flows up through the production casing. The steel expands. The free section of casing between the wellhead and the point where cement holds it in place elongates. The wellhead moves up.
In thermal recovery operations (steam injection in heavy oil fields), this can be dramatic – 40 to 50 mm of wellhead uplift during injection cycles. In conventional production, it’s typically less, maybe 5 to 15 mm, but it’s persistent and it’s real. The key factors are reservoir temperature, the length of the unsupported casing section, and the thermal expansion coefficient of the steel.
Why does this matter? Because the wellhead is connected to the platform process equipment through flowlines, jumpers, and piping. When the wellhead moves up and the deck doesn’t, those connections absorb the load. Flanges get stressed. Fatigue cycles accumulate. Seals degrade. In the worst cases, accumulated displacement and fatigue can compromise conductor and connection integrity, with the cause only becoming clear once dedicated monitoring is in place.
Structural deformation
The platform structure itself can deform. Wave loading, wind, ice (in Arctic and subarctic environments), shifting foundation conditions, corrosion-weakened members – all of these change the geometry of the structure over time. A jacket that was plumb when installed may develop a tilt. A deck that was level may develop differential settlement between its support points.
These movements are typically small – millimetres to low centimetres – but they compound the difficulty of interpreting wellhead and equipment movements. If the deck tilts 2 mm across 30 metres, and you’re measuring wellhead positions from deck benchmarks, you need to know about that tilt or your wellhead data is wrong.
The measurement challenge
Here’s the core difficulty. On land, deformation monitoring is conceptually simple: you establish benchmarks on stable ground, measure the structure relative to those benchmarks, and any change represents movement. Done.
On a platform, there is no stable ground. Everything might be moving. The deck, the wellheads, the seabed – all potentially in motion, at different rates, in different directions. The question isn’t “how much did it move?” The question is “what moved relative to what, and does that relative movement matter?”
Solving this requires measurements at four distinct levels.
Level 1: absolute position (GNSS)
Permanent GNSS stations on the platform establish its absolute position in a global reference frame (ITRF). Modern processing – phase-ambiguity-fixed Precise Point Positioning – achieves 3 to 4 mm RMS horizontally and 7 mm vertically for daily solutions. Those figures assume a rigidly mounted antenna on a stable monopod and multi-week occupation for the trend; raw daily verticals from an antenna on a flexing topside rarely reach 7 mm and have to be filtered over time. Over weeks and months, trends emerge at the sub-millimetre-per-year level.
This tells you the platform’s absolute subsidence rate. If the GNSS shows 15 mm/year of vertical settlement, the platform is sinking. But it doesn’t tell you what’s happening inside the platform – whether all elements are moving together or whether some are moving independently.
Level 2: relative deck network (levelling and total station)
A network of benchmarks on the platform’s structural members – jacket legs, main columns, deck beams considered structurally rigid – serves as the local reference frame. From these benchmarks, precise levelling (digital levels, 0.3 to 1.0 mm/km accuracy) and robotic total stations (0.5 arcsecond angular, sub-millimetre linear) measure the positions of wellheads, flowline attachment points, and process equipment.
This is where you detect relative movements. Wellhead three is 8 mm higher than last survey relative to the deck benchmarks. Wellhead seven has shifted 3 mm laterally. The manifold support has settled 2 mm on the port side.
Combine this with Level 1 data and you can calculate absolute movements. If the platform sank 15 mm (GNSS) and the wellhead rose 8 mm relative to the deck, then the wellhead’s absolute movement is -7 mm – it sank, but less than the platform. The 8 mm of relative uplift is what stresses the flowline connections.
Level 3: downhole measurements
The Radioactive Marker Technique (RMT) places weakly radioactive markers at fixed intervals (typically around 10 m) along a non-productive well. Wireline gamma-ray tools – the Formation-Compaction Monitoring Tool (FCMT) is the current implementation – measure changes in marker spacing between logging runs. Modern tooling achieves a nominal accuracy on the order of 1 mm over a 10 m marker interval.
These tell you where in the geological column the compaction is occurring. Is it the reservoir? The overburden? A specific clay layer? This is critical input for the geomechanical model that predicts future subsidence.
Level 4: seafloor monitoring
Seabed pressure transponders measure absolute water depth changes with centimetric sensitivity, which translates to seabed vertical movement. Sonardyne’s self-calibrating Fetch AZA (Ambient-Zero-Ambient) pressure monitoring transponders were deployed at scale at Shell’s Ormen Lange gas field in 2020 – more than 20 units in 800 to 1,100 m water depth. The AZA design periodically re-calibrates the pressure sensor in situ to counter long-term drift, allowing autonomous operation with centimetric accuracy for up to 10 years. Data is harvested acoustically by a vessel or an uncrewed surface vehicle, with no need to retrieve the instruments.
Repeat bathymetric surveys map the shape of the subsidence bowl – the broad depression in the seabed centred on the reservoir.
GNSS-Acoustic (GNSS-A) combines surface GNSS positioning with acoustic ranging to seafloor transponders, providing absolute seabed positions at centimetre accuracy.
The statistical question
Raw measurements are not enough. Saying “the wellhead moved 3 mm” is meaningless without knowing the measurement uncertainty. If your levelling accuracy is ±2 mm, a 3 mm change might be noise.
Geodetic deformation analysis handles this rigorously. You adjust two network epochs separately, then test whether the coordinate differences are statistically significant using methods like the Pelzer test or Baarda’s data snooping. This separates real movement from measurement noise, and further distinguishes rigid-body displacement (the whole platform shifting) from internal deformation (elements moving relative to each other).
This is not a trivial exercise. It requires properly designed survey networks, redundant observations, and consistent measurement procedures across epochs. It requires geodesists who understand both the mathematics and the physical processes. This is where geomatics earns its place at the table.
What good monitoring looks like
A well-designed offshore deformation monitoring program integrates multiple methods at appropriate frequencies:
| Method | Frequency | Purpose |
|---|---|---|
| Permanent GNSS | Continuous | Absolute platform settlement rate |
| Precise levelling | 1–4 times/year | Relative height changes between elements |
| Robotic total station | 1–2 times/year or continuous | 3D positions of all control points |
| Terrestrial laser scanning | Annually or as needed | Full 3D structural comparison |
| Seafloor pressure transponders | Data harvest every 3–9 months | Seabed subsidence |
| Bathymetry | Every 1–3 years | Subsidence bowl mapping |
| Tiltmeters | Continuous | Structural inclination monitoring |
| Downhole compaction (RMT/FCMT) | Per programme (1–5 year intervals) | Reservoir compaction profiling |
Alert thresholds need to be defined in collaboration with structural engineers and integrity management teams. Typical alarm levels might look like this:
| Parameter | Green | Amber | Red |
|---|---|---|---|
| Annual subsidence rate | <5 mm/yr | 5–20 mm/yr | >20 mm/yr |
| Differential settlement between adjacent wells | <2 mm | 2–5 mm | >5 mm |
| Platform tilt | <1:1000 | 1:1000–1:500 | >1:500 |
| Wellhead growth | <10 mm | 10–30 mm | >30 mm |
| Relative wellhead-to-flowline displacement | <5 mm | 5–15 mm | >15 mm |
These values are illustrative starting points only, not a specification to be lifted verbatim. The actual green/amber/red bands must be derived from the structure-specific geomechanical and structural model and signed off by the structural and integrity teams – a gravity-based structure on chalk has different tolerances than a jacket on clay. But every platform needs defined thresholds, agreed with the structural and wells teams, before the monitoring programme starts.
Where geomatics fits
Geomatics sits at the intersection of multiple disciplines on this problem. The structural engineers need to know actual deformations to validate their models. The geologists and geomechanics specialists need subsidence data to calibrate reservoir compaction predictions. The wells team needs to understand conductor growth to manage wellhead integrity. The piping engineers need relative displacement data to assess flowline fatigue.
Only geomatics can provide the measurement framework that ties all of these together. Only geomatics operates in a rigorous coordinate reference system that connects the platform to the global geodetic network through the local survey network down to individual wellhead positions. And only geomatics applies the statistical tools to determine whether an observed 4 mm movement is a real signal or just measurement uncertainty.
When anomalous movements are detected, the response follows a clear sequence: verify the data (is it a measurement error or are the benchmarks themselves unstable?), determine the direction and rate (vector analysis, trend over time), classify the source (seabed subsidence, thermal growth, structural deformation), assess the impact on connected systems (flowlines, equipment, safety-critical elements), and implement corrective actions (from increased monitoring frequency up to production shutdown).
The standards framework supports this approach. API RP 2SIM provides the structural integrity management methodology. ISO 19901-9 covers structural integrity management for offshore structures. IOGP Report 624-02-01 sets the common industry technical specification for calibration and verification of offshore surface survey and positioning systems. The tools and standards exist. The question is whether operators invest in using them before the problems become expensive.
The bottom line
An offshore platform is not a static object. It sits on compacting rock, carries thermally active wells, and endures decades of environmental loading. Millimetre-scale movements accumulate into centimetres, and centimetres stress connections, distort alignments, and eventually compromise integrity.
Geodetic monitoring is the early warning system. It doesn’t prevent subsidence or conductor growth – those are geological and thermal realities. But it detects them early, quantifies them precisely, and distinguishes dangerous relative movements from benign absolute ones. The discipline that makes this possible – geomatics – is often the most understaffed and underfunded department on the platform. Until something moves that shouldn’t have.
Based on: published reviews of offshore subsidence monitoring techniques (2024); Sonardyne Fetch AZA deployment at Ormen Lange; Ekofisk and Valhall subsidence records; API RP 2SIM; ISO 19901-9; IOGP Report 624-02-01.
Published by
Positioning & Geodesy Working Group
GNSS, INS/IMU & Coordinate Systems
A working group of positioning specialists covering GNSS, inertial navigation, datum transformations, and geodetic network design for marine and land survey operations.
Read next
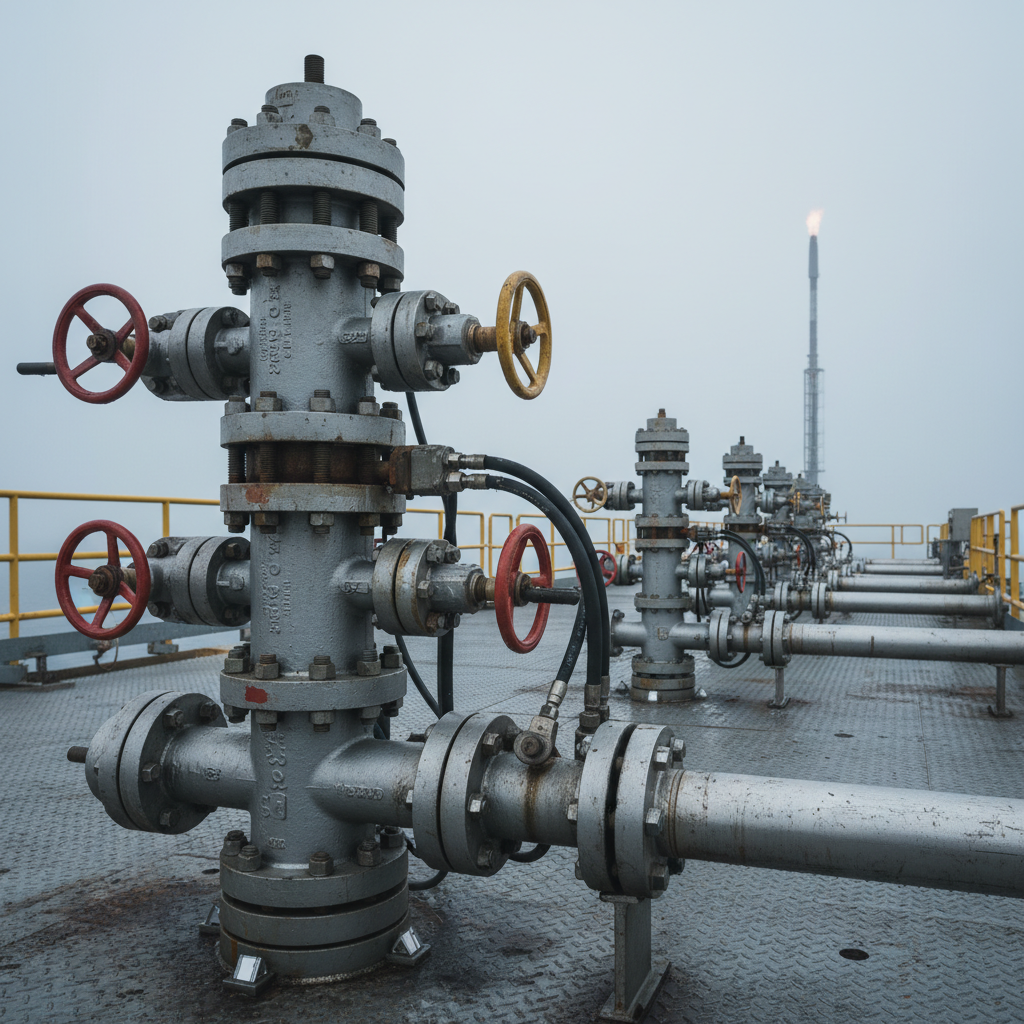
Offshore platform subsidence vs growth: the compaction problem
Separating platform subsidence from wellhead growth needs geodetic precision. Ekofisk learned it the hard way. How compaction shifts your survey datum.
£180M National Timing Centre: what offshore survey can expect (and can't)
UK £180M National Timing Centre backs up GNSS timing on land. What it means for offshore positioning assurance, and why it does not remove GNSS redundancy.
Strait of Hormuz guidance: what survey managers need to know now
Industry Hormuz transit guidance flags GNSS jamming and spoofing. Practical positioning-integrity steps survey managers should verify before mobilisation.
Offshore Geomatics Foundation Certificate · October 2026
Turn reading into certified competence
If your team makes calls like the ones above, a verifiable baseline of offshore geomatics competence is worth more than another CV claim.
Early-access list gets 40% off at launch. No spam – the waitlist is only ever used for the certificate. What the certificate covers →