Executive Summary
Deformation monitoring on offshore platforms turns on one question every survey manager faces: what is moving relative to what. The platform settles, wellheads grow under thermal load, and the seabed compacts above a depleting reservoir. Confusing these movements is how Ekofisk ended up jacking six platform decks. Getting it right means integrating GNSS, precise levelling, total-station work, and subsea pressure sensors into one coordinate framework – and knowing which measurement answers which question.
On this page21 sections
- The question that matters
- What happened at Ekofisk
- The methods: what actually measures what
- GNSS: your absolute reference
- Precise levelling: the relative workhorse
- Total-station surveying: 3D relative positioning
- Subsea pressure sensors: the absolute seafloor reference
- Hydrostatic levelling: continuous relative height
- Downhole measurements: going to the source
- The conductor growth problem
- Untangling the movements
- What clients get wrong
- 1. Assuming the platform is a fixed datum
- 2. Monitoring too infrequently
- 3. Ignoring horizontal movement
- 4. No subsea reference
- 5. No cross-discipline integration
- Standards and thresholds
- What actually works
- The geomatics role
- Practical recommendations
The question that matters
You are on the platform deck with a real problem: a wellhead has risen 40 mm relative to a reference point on the platform leg. What actually happened? Thermal expansion of the conductor, the platform settling, seabed compaction, or some combination of all three? The answer is not academic. Read it wrong and you misallocate millions, or you miss bending stress building in a riser until it fails.
Deformation monitoring offshore is a different problem from onshore. On land you can usually treat distant bedrock as fixed. Offshore, nothing is fixed. The platform settles, the wellheads behave on their own thermal and mechanical schedule, and the seabed compacts at a rate that depends on the reservoir below it. Every measurement is relative to something that is itself moving. Resolving that is a geodetic problem, and geodesy is the discipline that can tie surface measurements, subsea sensors, and downhole instruments into one coordinate framework – but only if you understand what each instrument is actually measuring.
What happened at Ekofisk
The Ekofisk field in the Norwegian North Sea is the reference case. In November 1984 the operator confirmed that the seabed was subsiding. The reservoir is a roughly 300 m thick chalk section about 3,000 m below the seafloor; as pore pressure dropped during production, the highly porous chalk compacted, and that compaction propagated up through the overburden to the seabed. The result was a bowl-shaped depression on the order of several metres deep, spanning roughly 6 km across, with the platform complex sitting in the middle of it.
The fix was as direct as it was expensive. In the summer of 1987 the steel platform decks and their connecting bridges were jacked up in stages by hydraulic jacks to restore air gap above the rising sea. The bill ran to around a billion US dollars. The lesson was not “chalk compacts” – that was understood. The lesson was that the field had been measuring the wrong things, and the magnitude and rate of seabed movement were not pinned down early enough to act before the problem became a structural emergency.
Valhall, in the same Central Graben with the same Upper Cretaceous chalk and porosity well above 50%, took the lesson seriously. It recorded about 500 mm of seabed subsidence within roughly the first three years of production and then sustained rates on the order of 250 mm/year, prompting a permanent monitoring programme built around seabed pressure gauges, platform displacement monitoring, and downhole compaction measurement. Across the broader Norwegian shelf, gravimetry-and-pressure programmes reported by a 2024 review in Sensors put the contrast in perspective:
- Sleipner: about 20.8 mm/year
- Troll: about 12.17 mm/year
- Midgard: about 10.75 mm/year
- Ormen Lange: about 4.83 mm/year
- Snøhvit: about 1.88 mm/year
These are not short-lived test programmes. They are long-running monitoring efforts where understanding the deformation is a direct input to structural and reservoir decisions. The question behind all of them is the same one every operator should ask: do we actually understand how the ground under the platform is moving? Often the honest answer is no.
The methods: what actually measures what
GNSS: your absolute reference
GNSS is your global anchor. It gives the absolute position of the platform in a global or regional reference frame. With phase-ambiguity-fixed Precise Point Positioning and proper processing, daily solutions on an offshore platform can reach roughly 3–4 mm horizontal and around 7 mm vertical accuracy – good enough to resolve long-term trends. That is the baseline.
What GNSS does not give you is differential movement between individual platform elements. A wellhead can be growing 30 mm while GNSS shows the platform as a whole settling 15 mm; both are true, and GNSS sees only the aggregate. Its limits offshore are well known: metallic structure causes multipath, sky visibility is often poor, and high-latitude ionospheric conditions degrade accuracy. Used correctly, though, it is your primary source for absolute vertical movement, against which all the local relative measurements are anchored. Guoquan Wang’s 2023 case study in the Gulf of Mexico (Eugene Island 330, published in Structural Health Monitoring) demonstrated that stand-alone GNSS tied to a modern regional reference frame can deliver sub-centimetre long-term monitoring on a fixed platform, separating seafloor subsidence from sea-level rise.
Precise levelling: the relative workhorse
Digital levels are the workhorse for relative heights, with typical manufacturer specifications on the order of 0.3–1.0 mm/km – figures to verify on site against your own procedures and reference network, per IOGP 624-02-01, rather than assume. They give height differences, not absolute heights – and the differences are what matter for spotting trouble. The discipline is in the reference points: anchor them to the main load-bearing structure, run closed levelling loops, and analyse the loop closures. A closure outside tolerance means an error – either in the measurement or in the movement of a reference point you assumed was stable.
A practical regime is quarterly campaigns on any platform showing signs of deformation, each point compared against its baseline and tested statistically (Pelzer or Baarda-style network adjustment and outlier tests). The output is precise but relative: you may learn that wellhead A has moved 8 mm relative to wellhead B and reference point C, while the absolute positions stay unknown until GNSS supplies them.
Total-station surveying: 3D relative positioning
Robotic total stations such as the Leica TS60 or Trimble S-series capture prisms on wellheads, pipe supports, and steel structure with manufacturer-quoted angular accuracy on the order of half an arc-second and distance accuracy around ±0.6 mm + 1 ppm. Treat those as nominal instrument figures; field accuracy depends on geometry, atmosphere, and prism setup, and the realised numbers should be verified against known coordinates per IOGP 624-02-01. The advantage over levelling is 3D: you get displacement vectors, not just vertical change. Place prisms on:
- Wellhead flanges (conductor and wellhead position)
- Pipe supports (to detect bending every 5–10 m)
- Valves (to verify equipment movement)
- Primary steel (to detect structural deformation)
Automate where the deformation is fast. On a high-temperature well, quarterly manual rounds miss the dynamics; automated total-station cycles every few hours can be correlated against production rate, weather, and tide.
Subsea pressure sensors: the absolute seafloor reference
To know whether the seabed itself has moved, deploy seabed pressure sensors – for example Sonardyne Fetch, or units from Valeport or Aanderaa. They measure pressure continuously and report acoustically at intervals, and a change in pressure converts directly to a change in water column, i.e. vertical seabed movement. Centimetric accuracy over a decade is achievable: Sonardyne’s at-scale Fetch AZA deployment at the Ormen Lange gas field for Norske Shell used self-calibrating Ambient-Zero-Ambient sensors (around two dozen units in 800–1,100 m water) to hold that accuracy for up to ten years without retrieval.
That lifespan is the point: once installed, the array logs for the life of the field, which repeated survey-vessel campaigns cannot match. Distribute the sensors across the whole subsidence bowl, not just a tight cluster – compaction produces a central depression over the reservoir, and three sensors in one spot will not resolve its shape.
Hydrostatic levelling: continuous relative height
Hydrostatic levelling can reach sub-millimetre relative accuracy between connected reference points, giving a continuous comparison of, say, a wellhead height against fixed structural points. Laboratory accuracy is at the micrometre level; realistic field accuracy is more like 1–10 mm. The benefit is continuity between major campaigns; the weakness is sensitivity to temperature, which drives drift and demands recalibration. Use it judiciously where continuous coverage between campaigns is worth the calibration burden.
Downhole measurements: going to the source
To locate compaction within the formation, the radioactive-marker technique places markers (commonly cobalt-60 bullets) into the formation or onto the casing at regular intervals, then logs the distance between them over time with a gamma-ray compaction tool such as Schlumberger’s Formation Subsidence Monitoring Tool. Sequential logs reveal where the formation is shortening, distinguishing reservoir compaction from movement of the overburden – a different cause needing a different response. Casing-deformation logging is a less precise alternative that avoids radioactive sources entirely.
The conductor growth problem
Thermal recovery makes the growth side of the problem vivid. In the Bohai Bay heavy-oil fields, cyclic steam stimulation drives measured wellhead uplift averaging 4–5 cm during heat injection, with extreme cases far higher. The mechanism is simple thermal expansion of steel: the free length of casing between the cement top and the surface is what governs how much the wellhead rises. Run the numbers with a steel expansion coefficient of about 12 × 10⁻⁶/°C, a temperature rise of ~150 °C, and a free length of ~2,500 m, and ΔL = α × L × ΔT gives roughly 45 mm – squarely in line with the field observations.
Why it matters: the wellhead moves relative to the seabed and the reservoir, which loads the connecting flowlines in bending and the flange connections in shear. Cyclic thermal movement drives fatigue. By the time growth reaches a few tens of millimetres, flowline and Christmas-tree design limits are in play. The defence is a proper baseline before production, then regular precise-levelling ties from structural reference points to the wellhead flanges, at a frequency set by the production temperature and injection cycle.
Untangling the movements
Here is how the framework resolves the confusion:
Step 1 – Establish absolute control. Put GNSS on the platform structure and tie it to ITRF or a regional frame. You get the platform’s absolute displacement vector: e.g. “the platform is settling 12 mm/year vertically and moving 3 mm/year horizontally to the northeast.”
Step 2 – Measure relative displacements. Precise levelling and total-station work from the control points to the monitored points, with statistical network adjustment, give the local movements: e.g. “wellhead 3 has risen 18 mm relative to control point A; wellhead 7 has dropped 5 mm; the control points are stable.”
Step 3 – Combine. Platform settled 12 mm (GNSS); wellhead 3 rose 18 mm relative to it, so absolute uplift is about 6 mm; wellhead 7 dropped 5 mm relative to the platform, so absolute subsidence is about 17 mm. Reading: wellhead 3 is growing thermally while the platform settles; wellhead 7 is subsiding faster than the platform, suggesting local compaction near that well.
Step 4 – Bring in the subsea data. If seabed pressure sensors show 15 mm of seafloor subsidence and GNSS shows 12 mm of platform settlement, the 3 mm difference hints at structural shortening or differential movement at the base. Note the caution, though: 3 mm sits inside the GNSS vertical noise floor of around 7 mm for a single epoch, so on its own it proves nothing. Treat it as a candidate signal only once a multi-epoch trend confirms it is real and not measurement scatter – something to watch and confirm, not to act on from one comparison.
Step 5 – Check formation compaction. If downhole monitoring shows 20 mm of formation compaction against 15 mm of surface subsidence, the ratio of 0.75 is your compaction-to-surface transfer factor – here a worked illustration, not a constant. This ratio is site-dependent and commonly well below 1; it should be established by geomechanics modelling and calibrated against your own measured compaction and subsidence, not assumed from a rule of thumb. It tells you how much reservoir compaction is reaching the surface.
The composite picture: the formation compacts, the seabed subsides, the platform settles with it, most wellheads move down with the platform, one grows thermally, one shows local compaction. No single instrument tells that story. GNSS alone will not, and levelling alone will not. You need the integrated system.
What clients get wrong
1. Assuming the platform is a fixed datum
Treating control points on the lower deck as absolutely fixed is the classic mistake. Monitoring programmes that use them as the datum get surprised when every wellhead appears to “grow” 15 mm/year – because the control points, the wellheads, and the whole structure are settling together. Measure against a moving datum and you cannot recover absolute movement. The fix is GNSS on the structure: without an absolute tie, every relative measurement is unanchored.
2. Monitoring too infrequently
Quarterly campaigns on a high-temperature well miss the short-term thermal cycle. A wellhead can rise 20 mm over six weeks during a ramp-up and fall 8 mm a month later; the quarterly snapshot records a net 12 mm and loses the peak entirely – the very signal that tells you about casing friction and cement bond. Where dynamics are fast, automate: robotic total stations, continuous GNSS, or hydrostatic levelling, with manual campaigns used to verify and to sweep the full well network.
3. Ignoring horizontal movement
Levelling sees only vertical change. Platforms tilt and wellheads lean; flowlines connect fixed points, and if those points shift horizontally the lines bend. A platform can show a benign 8 mm of vertical settlement while one corner moves 25 mm horizontally relative to the opposite corner – a tilt that buckles flowlines along that axis. It gets missed because “subsidence is vertical.” The fix is 3D monitoring: total station or GNSS at multiple points to catch tilt before it is visible.
4. No subsea reference
Measure platform deformation but ignore seabed subsidence and you cannot separate the two – a distinction that matters for decommissioning, riser integrity, and reservoir understanding. Seabed pressure sensors are not free; budget for instrument, installation, and periodic data-collection campaigns across the field life. Set against the cost of being blindsided by metre-scale seabed subsidence during decommissioning, the monitoring is cheap. Install seabed sensors at platform installation, plan for two decades of coverage, and treat data collection as an operating cost.
5. No cross-discipline integration
Surveys produce measurements, but the consumers sit elsewhere: structural engineers for FE models, reservoir and geomechanics engineers for compaction models, well engineers for thermal-growth analysis, and integrity managers for risk assessment. The common failure is geodetic data sitting in the survey department’s database, unread by anyone who needs it. Feed deformation monitoring directly into Structural Integrity Management aligned with API RP 2SIM, define alarm thresholds, and automate the data flow. A yellow exceedance triggers engineering review; a red exceedance triggers immediate investigation and, if needed, production constraints. The point worth stressing: these alarm bands are platform-structural rates – movement of a given structure relative to its design air gap and strain envelope – not reservoir-driven seabed-subsidence rates. The two are routinely confused, and the distinction is what the next section makes explicit.
Standards and thresholds
To be clear: API RP 2A-WSD and API RP 2SIM set the framework for structural assessment and integrity management but do not prescribe universal strain thresholds. They cannot – the thresholds are platform-specific and come out of the structural analysis for that asset.
One disambiguation before the table, because it is the single most common source of confusion. The “vertical” band below is a platform-structural alarm rate: how fast a given structure is moving relative to its own design air gap and strain envelope. It is not the reservoir-driven seabed-subsidence rate. Those are different quantities. A field can subside metres over compacting chalk and still be perfectly well managed – Valhall sustained roughly 250 mm/year of seabed subsidence and Sleipner around 20.8 mm/year, yet both run model monitoring programmes. Those figures are not “red platforms”; they are seabed rates the operators predicted, instrumented, and designed around. The traffic-light below applies to the structural response of a specific platform against its own engineered tolerances, not to how fast the seafloor under a field is sinking.
| Parameter | Green | Yellow | Red |
|---|---|---|---|
| Platform structural settlement rate | <5 mm/year | 5–20 mm/year | >20 mm/year |
| Settlement differential at wellhead | <2 mm | 2–5 mm | >5 mm |
| Platform inclination | <1:1000 | 1:1000–1:500 | >1:500 |
| Thermal growth at wellhead | <10 mm | 10–30 mm | >30 mm |
These values are illustrative only – placeholders to show the shape of a traffic-light scheme, not numbers to copy into a monitoring spec. Real thresholds must be derived from the asset-specific structural analysis under API RP 2SIM, tied to that platform’s structural capacity, air-gap reserve, and equipment tolerance; another platform’s numbers will differ and lifting this table verbatim into an integrity threshold would be wrong. The non-negotiable is setting thresholds before problems arise, not after. ISO 19901-9 governs structural integrity management at the principles level and leaves the detail to industry standards such as API and NORSOK; NORSOK N-005 covers in-service integrity management of structures and marine systems for the Norwegian continental shelf. IOGP Report 624-02-01 specifies calibration and verification of offshore surface survey and positioning systems – follow it. Claiming millimetre-level accuracy without verifying receivers against known coordinates is not defensible.
What actually works
In calm-water regions – the Gulf of Mexico, West Africa, Southeast Asia – fixed continuous GNSS is the strong default. In harsh environments like the North Sea in winter, downtime can gut your coverage, so plan redundancy. For ordinary platforms with no known sudden thermal or subsidence behaviour, quarterly precise-levelling campaigns plus an annual total-station survey will catch slow deformation before it runs away. For platforms over highly compacting formations (chalk, weak sands) or running high-temperature wells, go to continuous automated monitoring – robotic total stations, fixed GNSS, hydrostatic levelling as needed. Deploy seabed pressure sensors where seabed compaction is a known issue or regulator-mandated (the Dutch and Norwegian sectors), and install them from the start with annual or semi-annual collection.
On well monitoring, prioritise rather than instrument every well: sample across formations and production conditions. And integrate with SIM – deformation data left unused is worthless. Feed measurements into integrity management, set triggers, analyse trends quarterly, and update the structural model whenever observed deformation exceeds prediction.
The geomatics role
Geomatics builds the coordinate system everything else stands on. Reservoir engineers model compaction, structural engineers model platform behaviour, well engineers model thermal growth – and survey measures what actually happens. The distinct contribution is integrating the above-water and below-water domains into a single coordinate framework: GNSS for absolute position, precise levelling and total-station work for relative movement on deck, USBL/LBL to extend the frame subsea, seabed sensors for absolute seafloor position, and downhole tools for reservoir deformation. Each uses different physics and carries different error sources, so tying them together demands real geodetic rigour – defined control points, sound transformation parameters, and statistical proof that the uncertainties are controlled. Get that right and every other discipline has a trustworthy geometric foundation. Get it wrong and they are all building on questionable coordinates.
Practical recommendations
Before platform installation:
- Specify the monitoring system at FEED stage.
- Mark control-point locations on the design drawings.
- Design GNSS antenna mounts into the structure from the start.
- Budget for subsea sensors.
- Set alarm thresholds from the structural analysis.
During commissioning:
- Run baseline surveys before production starts.
- Verify the stability of every control point – no exceptions.
- Commission automated systems and confirm the data meets requirements.
- Integrate the data flow with SCADA/SIM.
During operation:
- Hold to the monitoring plan.
- Process and analyse data promptly – within 48 hours of receipt.
- Investigate yellow-level exceedances within 30 days.
- Update the structural model annually with measured deformation.
- Cross-reference deformation against production data to understand the drivers.
When deformation exceeds prediction:
- Validate the measurements (re-survey, cross-check with another method).
- Identify the cause – reservoir, seabed, structure, or thermal.
- Assess the impact on facilities and pipelines.
- If structural integrity is at risk, consider reducing production.
- Increase monitoring frequency while the situation is unresolved.
This is not theory. Ekofisk paid to learn what inadequate early monitoring costs; Valhall shows why integrated, permanent systems are a necessity rather than a luxury. Many other fields sit somewhere between manageable and serious. The tools to tell the difference exist – the failure is not using them until something has already gone wrong.
Published by
Positioning & Geodesy Working Group
GNSS, INS/IMU & Coordinate Systems
A working group of positioning specialists covering GNSS, inertial navigation, datum transformations, and geodetic network design for marine and land survey operations.
Read next
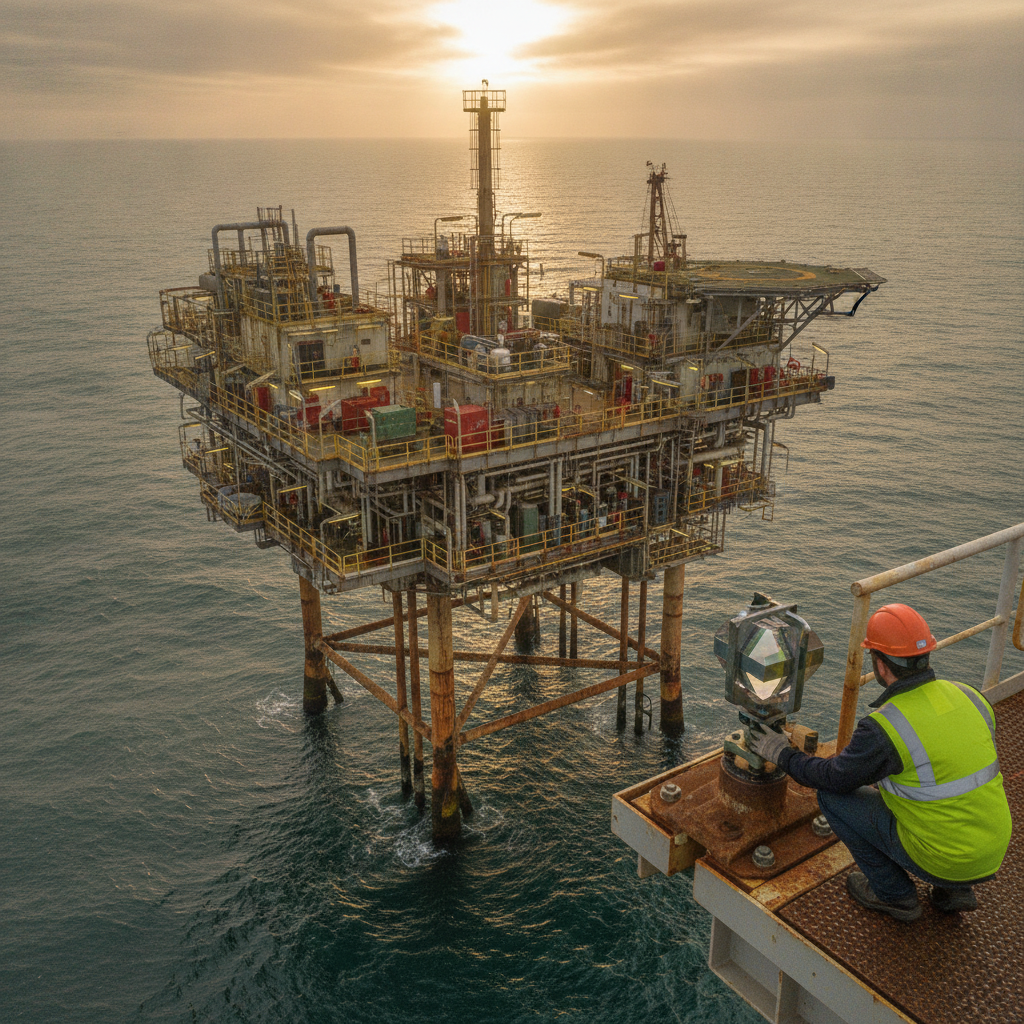
When your platform moves: geodetic monitoring of offshore structural deformation
Offshore platform deformation monitoring: GNSS, levelling and seafloor transponders to separate subsidence, wellhead growth and structural movement.

£180M National Timing Centre: what offshore survey can expect (and can't)
UK £180M National Timing Centre backs up GNSS timing on land. What it means for offshore positioning assurance, and why it does not remove GNSS redundancy.
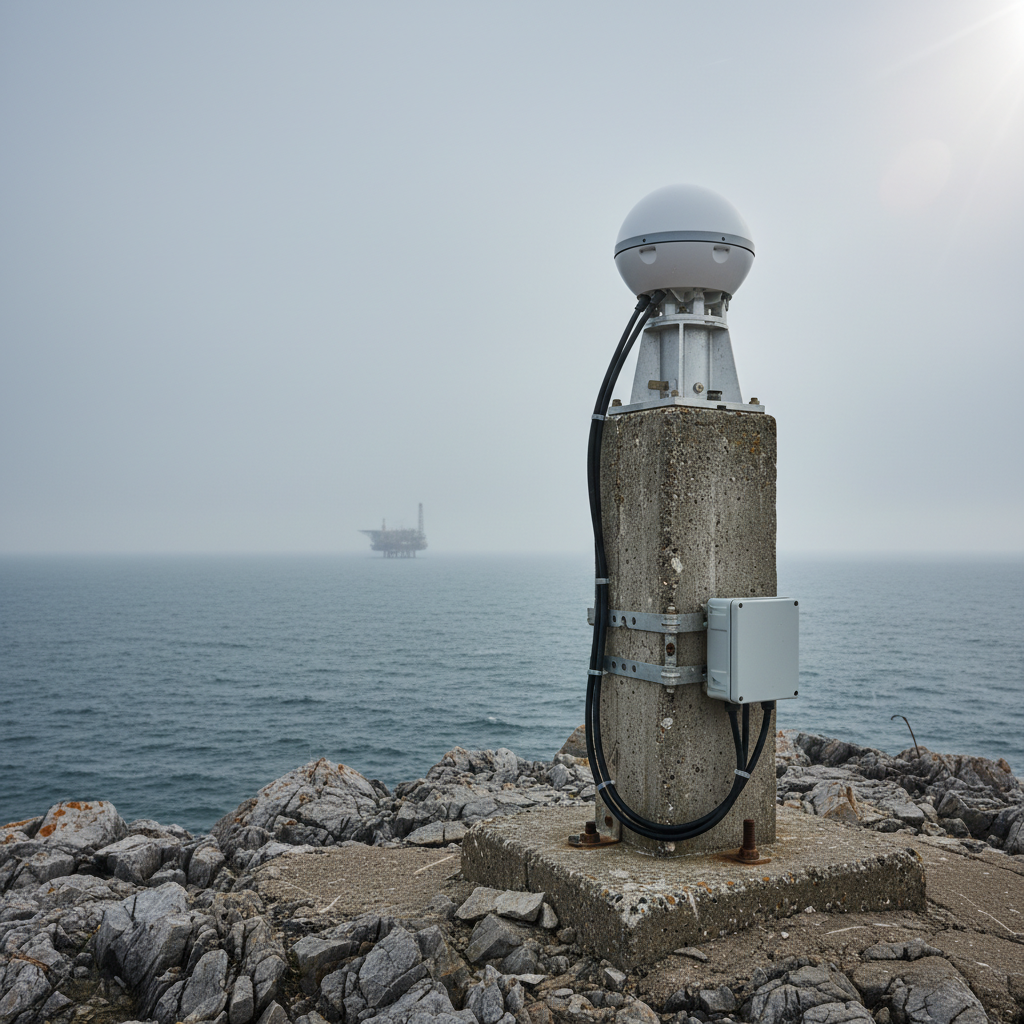
Strait of Hormuz guidance: what survey managers need to know now
Industry Hormuz transit guidance flags GNSS jamming and spoofing. Practical positioning-integrity steps survey managers should verify before mobilisation.
Offshore Geomatics Foundation Certificate · October 2026
Turn reading into certified competence
If your team makes calls like the ones above, a verifiable baseline of offshore geomatics competence is worth more than another CV claim.
Early-access list gets 40% off at launch. No spam – the waitlist is only ever used for the certificate. What the certificate covers →