Executive Summary
The Australian Hydrographic Office has begun Australia's first live shipboard trial of S-100 navigation data, putting S-104 water-level and S-111 surface-current datasets onto the bridge of two Carnival cruise ships during normal Sydney Harbour operations. Delivered at 100-metre resolution in 20-minute intervals, the data is being tested where it matters: a constrained, high-traffic port where one vessel passes under the Harbour Bridge with as little as two metres of clearance. The exercise is a navigation and ECDIS workflow trial, not a dynamic-positioning study, but it is the clearest signal yet of how bridge teams use high-resolution, frequently updated environmental data under real operational pressure.
On this page10 sections
- The first live S-100 trial in Australian waters
- Why this matters
- What the trial actually tests
- Where clients get it wrong
- 1. Assuming S-100 eliminates forecast uncertainty
- 2. Ignoring data latency and update frequency
- 3. Neglecting human factors in display design
- What this means for survey-data clients
- What this trial is not: A word on DP
- Recommendations
The first live S-100 trial in Australian waters
The Australian Hydrographic Office (AHO) has launched Australia’s first live shipboard trial of S-100 digital navigation data. The trial places S-104 water-level and S-111 surface-current datasets directly into the bridge ECDIS of operational cruise vessels during their normal Sydney Harbour rotations. It is run by the AHO with ocean-data specialist Tidetech and ECDIS software provider OSI Maritime Systems, aboard two Carnival Cruise Lines vessels, Carnival Splendor and Carnival Adventure.
The data is delivered at 100-metre resolution in 20-minute intervals. That cadence is deliberate: Sydney Harbour has a meaningful tidal range, currents that shift quickly, and heavy traffic. Carnival Adventure passes beneath the Sydney Harbour Bridge with as little as two metres of clearance overhead, so accurate, current water-level information is operationally significant rather than a convenience.
S-100 has been evaluated in Australian waters before, but through simulator-based testing rather than live operations. This is the first time the data products have been trialled aboard vessels in service. Insights from the trial are expected in early June 2026. According to Alvaro Sanchez, the AHO’s director of national charting, the point of going live is to get feedback from bridge crews working a busy port day to day – feedback no simulator fully reproduces. Tidetech CEO Penny Haire frames the shift plainly: S-100 treats tides and currents as live navigational information, not background reference data.
Why this matters
S-100 is the IHO Universal Hydrographic Data Model, the framework for the next generation of navigational data products. Its Phase 1 specifications – including S-101 (the ENC successor to S-57), S-102 (bathymetric surface), S-104 (water level) and S-111 (surface currents) – entered into force in January 2026, and S-100 ECDIS is now legal for use, with a dual-fuel transition running alongside S-57 charts until 2029. The Sydney trial is one of the first chances to see whether the operational reality matches the specification.
The recurring problem with environmental data is not the standard. It is the gap between a clean specification and what a bridge team can actually act on under pressure. The real question is whether high-accuracy, continuously updated tide and current data earns its place on a working bridge when traffic is dense and margins are thin – whether it sharpens decisions or just adds clutter. That is the stake: if the data cannot be trusted and read at a glance in a confined, high-traffic harbour, the specification on its own proves nothing.
This matters beyond cruise navigation. Any operation that overlays environmental data on a navigation or positioning display has the same dependency: standardised, verified, frequently updated tide and current information that the people on watch can rely on. The transferable finding here is the human-factors and integration lesson – how crews read and act on layered environmental data – not the harbour-specific data spec. The Sydney trial does not validate every use case, but that integration lesson reads across to the wider sector, which has been short of real-world evidence of this kind.
What the trial actually tests
Survey-data clients have learned to treat environmental data with caution, and for good reason. Operations have too often leaned on optimistic forecasts, coarse current atlases, or tidal predictions that ignored local bathymetry. S-100 changes how that data is structured and distributed; it does not change the underlying physics. High-precision tidal models are still models. Surface-current fields are derived from hydrodynamic modelling or from point measurements, and even ADCP measurements carry uncertainty from depth, sea state and acoustic conditions.
What S-100 genuinely improves is timeliness, format consistency, and the ability to overlay environmental layers cleanly without manual reformatting. The Sydney trial puts that mechanism to work in service: whether crews can activate S-104 to watch a tidal window, overlay S-111 for current set, and suppress either layer when it is only adding clutter. If the workflow is not intuitive, crews fall back on familiar methods regardless of how good the data is – which is exactly the integration behaviour the trial is set up to observe.
Where clients get it wrong
1. Assuming S-100 eliminates forecast uncertainty
Some clients treat S-100 as a technical fix for a physical problem. It is not – the standard carries the same model and measurement uncertainty as the data inside it, just in a cleaner wrapper. The practical consequence is what to expect from procurement: anyone specifying S-100 hoping for perfect positional awareness will be disappointed, while anyone who wants frequently updated, verified, consistently formatted data to sharpen an existing picture will get real value. Buy it for timeliness and interoperability, not for accuracy it cannot deliver.
2. Ignoring data latency and update frequency
It is common to discuss S-100 integration without pinning down update rate or latency. An hourly tidal model is little use if conditions move meaningfully within the hour. Surface-current data with a 30-minute delay can be stale in fast-changing weather. The 20-minute interval used in Sydney is not arbitrary – it reflects how quickly that harbour changes. Clients should define minimum update rates for their own conditions rather than accepting a generic “S-100 compliant” claim. A sheltered, low-energy site tolerates slower updates; a high-energy site on a spring tide does not.
3. Neglecting human factors in display design
Compliance with S-100 says nothing about whether the result is usable. A watchkeeper is already managing multiple displays, alarms and communications. If an environmental data layer adds workload without a clear operational return, it will be ignored or switched off. The Sydney trial is explicitly looking at how crews interact with S-100 layers in real operations. That focus on human factors, not just technical conformance, is what separates a meaningful trial from a checklist exercise. Clients specifying S-100-enabled systems should insist on the same scrutiny.
What this means for survey-data clients
Specification conformance alone is not enough. For S-100 environmental layers to add value operationally, three things have to line up: data providers must understand the timing and scope of the operation; the data has to integrate cleanly into the display crews actually use; and the integration has to be validated under realistic conditions, not just signed off on paper. The Sydney model is a good template – the hydrographic office working directly with a data provider and operating vessels to prove the data in service.
For hydrographic survey specifically, the live products have direct uses beyond the bridge. An S-104 water-level product can in principle serve as a tide source for vertical referencing – reducing soundings to chart or ellipsoidal datum – but only if its uncertainty is known and carried through. Water-level error does not vanish because it arrives in an S-100 container; it has to enter the depth total propagated uncertainty (TPU) and be checked against the relevant S-44 (Edition 6.1.0) order limits. An S-104 cell quoted without an uncertainty figure is not a qualified vertical-control source, however convenient the format. On the operability side, an S-111 surface-current product is a candidate input for planning ROV, AUV and diving windows: standardised, frequently updated current fields make it easier to forecast when set and drift fall inside vehicle or diver limits – again, only as good as the model behind the field.
Resolution and update cadence should be matched to the site, not taken as a fixed value. A 100-metre grid at 20-minute intervals suits a constrained harbour like Sydney; an open, deep-water site may care more about update frequency than spatial detail, while complex bathymetry may demand finer resolution. There is no universal setting. As a working illustration: on a high-energy spring-tide site, a 20-minute update interval may already be marginal and an hourly water-level model with a comparable processing-and-delivery latency would be unfit for reducing soundings in real time, because the tide can move further within that window than the survey can tolerate in its vertical budget. Set the threshold from your own conditions and uncertainty allowance, not from a vendor default.
What this trial is not: A word on DP
This is a navigation and ECDIS trial. It is tempting to read across to dynamic-positioning operations, but S-100 is a navigational data model, not a DP control input, and none of the published material on the Sydney trial makes that link. DP systems take environmental information from their own sensors – anemometers, vessel-mounted current profilers, motion reference units – and from external forecast feeds. Whether standardised S-100 tide and current products could ever serve as a qualified input to those systems is an open engineering question for class societies and DP manufacturers, not something this harbour trial demonstrates. Treat any vendor claim that conflates the two with caution.
Recommendations
- Specify minimum update intervals and maximum acceptable latency for any S-100 environmental data, tied to your site conditions. Do not accept “S-100 compliant” as an answer on its own.
- Validate the integration in realistic scenarios, not just at factory acceptance. Run cases where conditions change mid-operation and confirm the display behaves sensibly.
- Keep local sensors. S-100 data complements ADCPs, anemometers and motion sensors; it does not replace them, and external links can fail.
- Demand evidence on ergonomics, not just conformance. If watchkeepers find the displays cluttered, they will ignore them regardless of data quality.
- Remember what S-100 is: a data model and distribution standard, not a measure of forecast accuracy. Uncertainty does not go away – plan for it.
The Sydney Harbour trial is real progress: S-100 tide and current data validated on a working bridge, in service, in one of Australia’s most constrained ports. The results due in June will say more about whether the workflow holds up than any specification can. Conformance shows intent; live testing shows capability.
Based on: Australia Puts S-100 to the Test on Sydney Harbour
Published by
Hydrographic Methods Committee
Bathymetry, Multibeam & Seabed Mapping
An independent review committee focused on hydrographic survey methodology, IHO standards interpretation, and seabed mapping best practices for offshore and coastal projects.
Read next
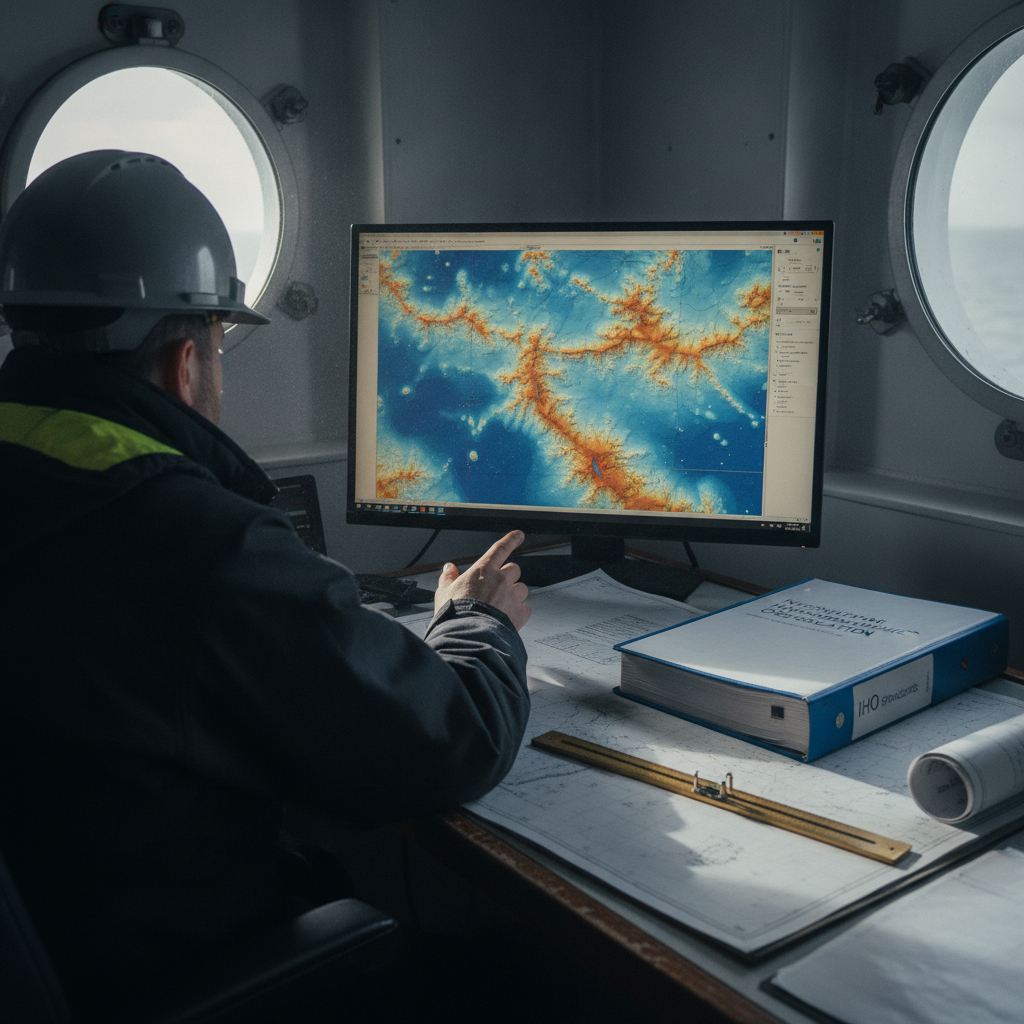
S-100 Phase 1 is live: what survey contractors must change now
IHO S-100 Phase 1 is live (Jan 2026): seven product specs released. What hydrographic survey contractors must change in data workflows now.
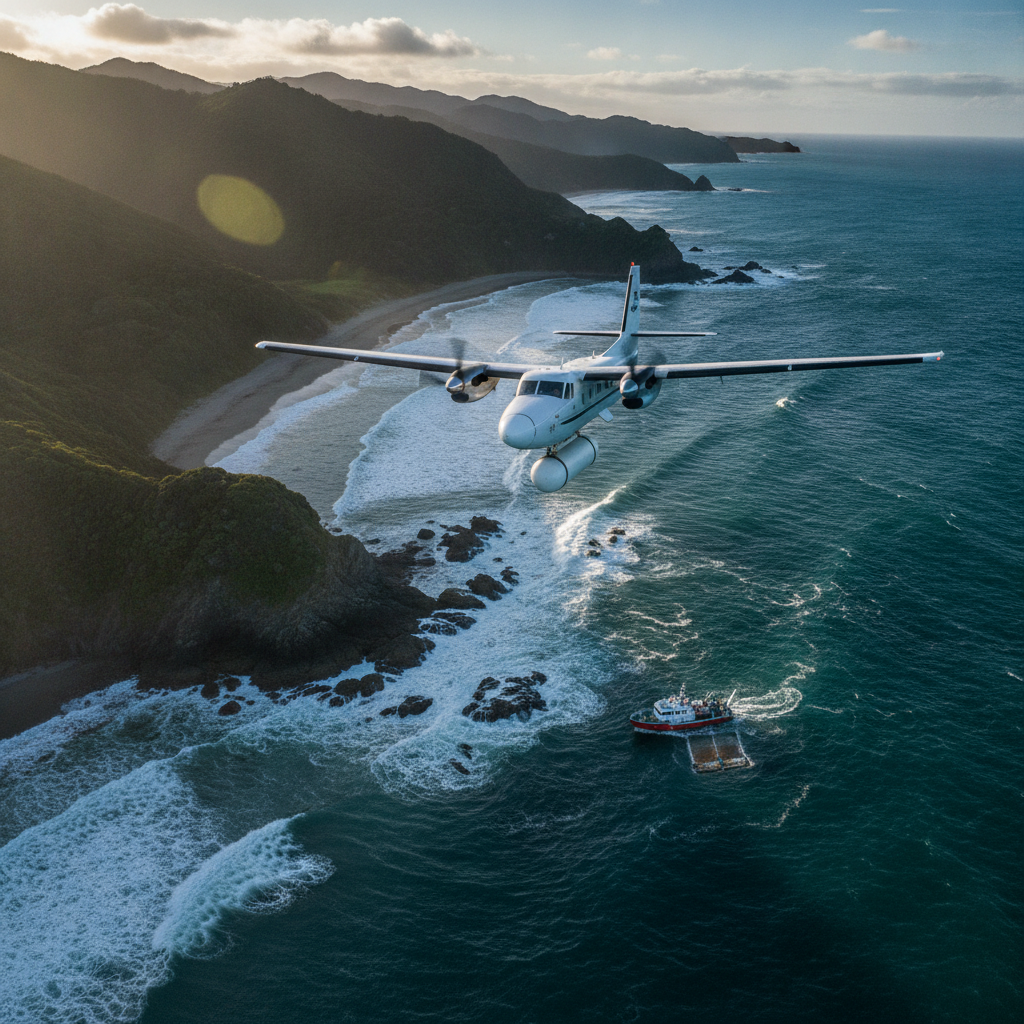
What New Zealand's 3D coastal programme reveals about nearshore surveys
How multi-sensor nearshore survey actually works: LINZ's three-year topobathymetric programme maps up to 40% of New Zealand's coast.
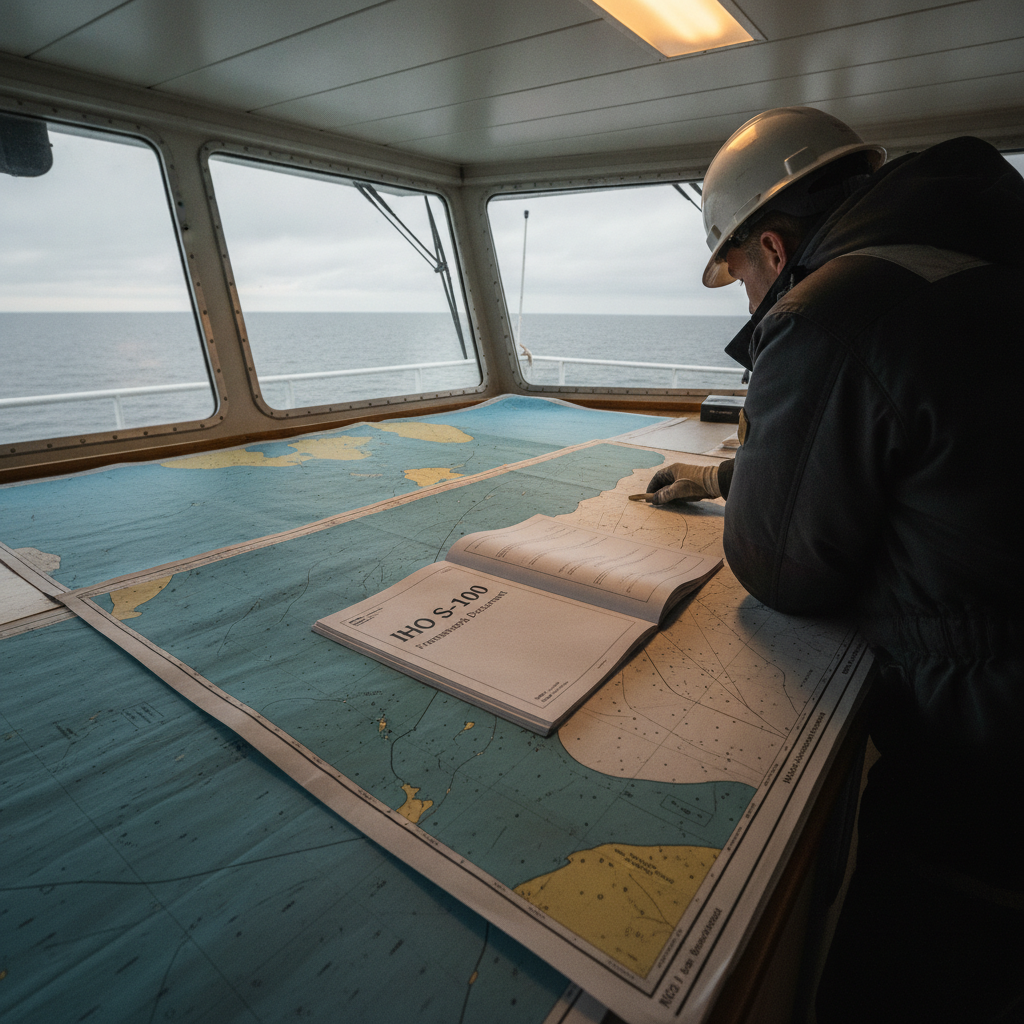
New IHO leadership and what S-100 means for offshore contractors
S-100 Phase 1 in force: dual-fuel transition, S-101/S-102 deliverables and tender impact for survey contractors.
Offshore Geomatics Foundation Certificate · October 2026
Turn reading into certified competence
You have just read what a standard actually requires – and where it stops. The Foundation Certificate exists to prove you can work with that distinction.
Early-access list gets 40% off at launch. No spam – the waitlist is only ever used for the certificate. What the certificate covers →